Violin Plot
Violin Plot is used to display data distribution and density, combining the advantages of both Box Plot and Kernel Density Plot. SPSSAU supports:
Batch drawing based on 'titles'.
Include categorical items (e.g., gender) to create violin plots for different categories.
Data Format
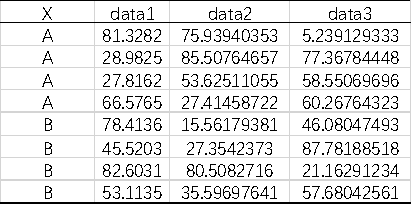
The data includes 1 Category and the analysis data (Categories can be omitted during analysis).
Calculation Steps
The principle of the Violin Plot is to overlay a 'Kernel Density Plot' and a 'Box Plot' to visually represent data distribution. For detailed algorithm content, refer to the methods of 'Kernel Density Plot' and 'Box Plot.'
Note:
When drawing a Violin Plot, SPSSAU uses Gaussian by default, automatically calculates bandwidth (h), and currently does not support manual customization.