Scatter Plot
Scatter plot visually represents the relationship between two quantitative variables, namely the relationship between X and Y. SPSSAU supports the following functions:
A maximum of 20 X variables can be input at once, with only one Y variable supported, allowing up to 20 X-Y relationships.
Color differentiation (optional) is available. A third categorical variable (e.g., gender) can be added to distinguish different categories in the X-Y relationship.
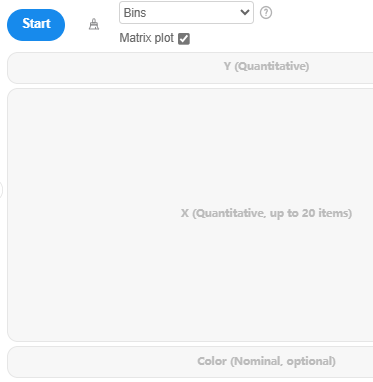
When there are too many X variables, 'Matrix plot' helps visually display the relationships between each X variable and Y.
The output can include 'linear trend'.
Scatter plots provide an intuitive view of relationships between data points. However, when there are too many points, identifying the X-Y relationship can be difficult. To address this, SPSSAU offers the bins function.
About Bins
In a scatter plot, 'bins' refer to grouping data points into different bins and summarizing the concentration trend within each bin. SPSSAU represents each bin using the mean value of the data points within that bin. For example, if a bin contains 100 data points, its value is represented by the average of those 100 points. The binning algorithm in SPSSAU follows these steps:
Given a set of scatter plot data , where n represents the total number of data points.
Step 1
Set the number of bins as b. When the number of data points exceeds 1000, SPSSAU automatically sets the number of bins to 100. Researchers can manually set the number of bins to 25, 50, 100, or 1000 or choose not to apply binning.
Step 2
Calculate the width of each bin: binWidth =
Step 3
Arrange x in ascending order, obtaining an ordered sequence . The bin edges are defined as:
Step 4
Round edges to obtain integer indices. The rounded boundaries are treated as closed intervals. Set the boundaries as , where e1 = ,eb+1 = .
Step 5
For each bins:j = 1,2,...,b, calculate:
Collect the set of x-coordinates in the bins:
Compute the average x-coordinate within the bins:
Compute the average y-coordinate within the bins:
Step 6
Output , and plot the scatter plot.
About Linear Trend
SPSSAU supports scatter plots with 'linear trend'. This feature applies linear regression fitting to calculate the relationship between X and Y. For more details on the algorithm, refer to the 'Linear Regression' documentation.