Roc Curve
Roc Curve (Receiver Operating Characteristic curve) is a graphical tool used to evaluate the performance of Meta for Binary models. It illustrates the relationship between the True Positive Rate (TPR, also called Sensitivity) and the False Positive Rate (FPR) under different classification thresholds. SPSSAU supports the following functions:
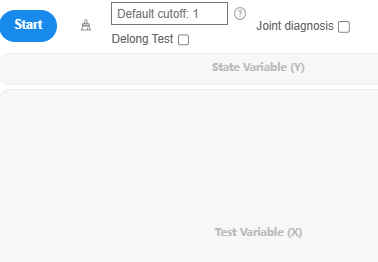
Batch select 'titles' for ROC Curve plotting and calculations.
Set cut points (default is 1, where 1 is positive and other values are negative).
Delong Comparison.
Joint diagnosis (only outputs joint diagnosis results if selected).
Hanley & McNeil test.
Roc Calculation Principle
1.Constructing a Confusion Matrix
First, a confusion matrix is created as follows:
| Predicted Positive | Predicted Negative | |
|---|---|---|
| Actual Positive | TP | FN |
| Actual Negative | FP | TN |
- The confusion matrix consists of four fundamental components:
- TP (True Positive) : The number of samples that are actually positive and correctly predicted as positive.
- TN (True Negative) : The number of samples that are actually negative and correctly predicted as negative.
- FP (False Positive) : The number of samples that are actually negative but incorrectly predicted as positive.
- FN (False Negative) : The number of samples that are actually positive but incorrectly predicted as negative.
2.Calculating TPR and FPR
-
True Positive Rate(TPR)
TPR represents the proportion of correctly identified positive samples out of all actual positive samples, calculated as:
-
False Positive Rate(FPR)
FPR represents the proportion of incorrectly identified negative samples out of all actual negative samples, calculated as:
Another important metric is specificity, which represents the proportion of correctly identified negative samples among all actual negative samples:
3.Setting Cut-off Points
Select different cut-off points and calculate TPR and FPR for each point. In SPSSAU, 'cut-off points' correspond to different values of the 'test variable (Y).'
4.Plotting ROC Curve
By plotting TPR (y-axis) against FPR (x-axis) for different cut-off points, ROC Curve is generated.
5.Calculating AUC
AUC (Area Under the Curve) quantifies the performance of ROC Curve, ranging from 0 to 1. AUC is calculated using numerical integration, with the trapezoidal rule being a common method. The formula for AUC is:
Use the trapezoidal rule to calculate AUC:
n represents the number of different cut-off points.
Other Metrics
Apart from AUC, SPSSAU also provides Optimal threshold (Youden Index), Sensitivity (TPR), Specificity, and Cut-off points.
Youden Index is defined as the maximum difference between TPR (Sensitivity) and FPR (1 - Specificity):
c represents the classification threshold. Youden Index ranges from 0 to 1, with values closer to 1 indicating better model performance.
Joint Diagnosis
When 'Joint Diagnosis' is selected, SPSSAU only outputs results for 'joint diagnosis.' This means all 'test variables (X)' and the 'status variable (Y)' are analyzed using Binary Logistic Regression, and the predicted values are used to generate the ROC curve results.
Hanley & McNeil test
For details on the Hanley & McNeil test, refer to the following literature: Hanley J A , Mcneil B J .The meaning and use of the area under a receiver operating characteristic (ROC) curve.[J].Radiology, 1982, 143(1):29.DOI:10.1148/radiology.143.1.7063747.
Delong Comparison
For details on Delong Comparison, refer to the following literature: Sun X , Xu W .Fast Implementation of DeLong's Algorithm for Comparing the Areas Under Correlated Receiver Operating Characteristic Curves[J].IEEE Signal Processing Letters, 2014, 21(11):1389-1393.DOI:10.1109/LSP.2014.2337313.
References
【1】The SPSSAU project (2024). SPSSAU. (Version 24.0) [Online Application Software]. Retrieved from https://www.spssau.com.
【2】周俊,马世澎. SPSSAU科研数据分析方法与应用.第1版[M]. 电子工业出版社,2024.
【3】Hanley J A , Mcneil B J .The meaning and use of the area under a receiver operating characteristic (ROC) curve.[J].Radiology, 1982, 143(1):29.DOI:10.1148/radiology.143.1.7063747.
【4】Delong E R , Delong D M , Clarke-Pearson D L .Comparing the areas under two or more correlated receiver operating characteristic curves: a nonparametric approach.[J].Biometrics, 1988, 44(3):837.DOI:10.2307/2531595.
【5】Sun X , Xu W .Fast Implementation of DeLong's Algorithm for Comparing the Areas Under Correlated Receiver Operating Characteristic Curves[J].IEEE Signal Processing Letters, 2014, 21(11):1389-1393.DOI:10.1109/LSP.2014.2337313.
【6】吕邦泰,杨昌国.用Excel软件制作ROC曲线评价系统[J].浙江检验医学,2003,02(v.1):43-44+46.