Quadrant Plot
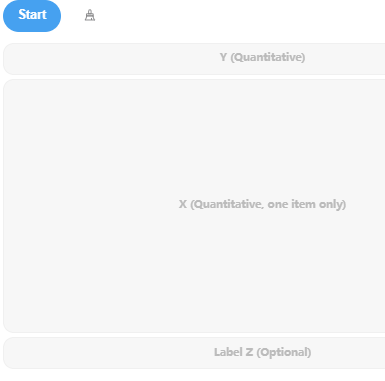
Quadrant Plot is a data visualization tool that divides the plane into four quadrants, facilitating relationship analysis. Essentially, it is a scatter plot and can be used for analyses such as Importance Performance Analysis (IPA). SPSSAU supports:
Only 1 X and 1 Y variable.
Label item Z, which can add textual annotations to scatter points.
Customize quadrant chart coordinate values and batch edit scatter point names.
Up to 1,000 scatter data points.
