Pareto Chart
Pareto Chart is a graphical tool used to display the importance or frequency of data. It combines a bar chart and a line chart to show the frequency or significance of different categories while marking the cumulative percentage. SPSSAU supports:
Batch analyze 'titles' using Pareto charts.
The dataset can include 'weight'.

Data Format
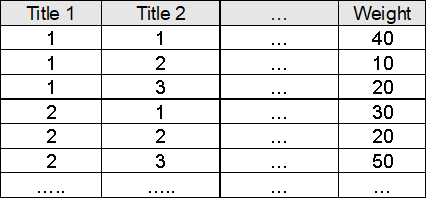
The table includes 'Title' and specific data. The 'Weight' represents the count of occurrences for each sample, and its significance can be defined through 'data label'.
Calculation Steps
1.Data Collection
Gather the categorical data for analysis, such as defect types, sales amounts, etc.
2.Calculate Frequency
Calculate the frequency (or importance) for each category. Suppose there are n categories, and the frequencies are f1, f2, ..., fn . If a weight variable is provided, the frequencies are calculated as w1 × f1, w2 × f2, ..., wn × fn,, where wi represents the weight data. If no weight is provided, assume wi = 1.
3.Calculate Total Frequency
Calculate the total frequency across all categories:
4.Calculate Percentage
Calculate the percentage of each category's frequency:
5.Calculate Cumulative Percentage
Calculate the cumulative percentage for each category:
6.Sort Categories
Sort categories in descending order based on their frequency.
7.Plot the Chart
Use a bar chart to display the frequency of each category. Overlay a line chart in the same plot to represent the cumulative percentage.