Markov Forecasting
Markov Forecasting is a forecasting method based on the Markov process, commonly used for modeling and predicting time series data. It is located in SPSSAU -> Comprehensive Evaluation -> Markov Forecasting.
SPSSAU Operations
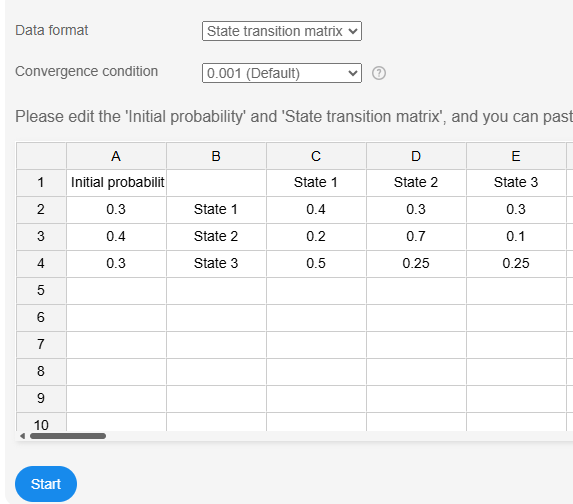
To perform the analysis, paste (or edit) the data into the data frame and click 'Start'. SPSSAU involves two key parameters: 'Data Format' and 'Convergence Condition'.
Data Format: SPSSAU supports two data formats: 'State Transition Matrix' and 'State Data'.
'State Transition Matrix' requires the input of "Initial Probability" and a "State Transition Matrix."
'State Data' requires the input of 'Initial Probability' and 'Original State Data'. The system will automatically compute the 'State Transition Matrix' from the 'Original State Data' and proceed with model prediction. 'Original State Data': This refers to state sequences such as '121313113'. For example, if numbers 1, 2, and 3 represent states A, B, and C, then '121313113' corresponds to: A->B->A->C->A->C->A->A->C. The system will use these transitions to compute the 'State Transition Matrix' for the three states (A, B, or C).
Convergence Condition: This defines the stopping criterion for iteration. The default value in SPSSAU is 0.001, meaning that the model stops iterating when the error falls below 0.001 (i.e., when fluctuations are within 0.1%). Alternative values include 0.0001, 0.00001, and 0.01.
SPSSAU Data Format
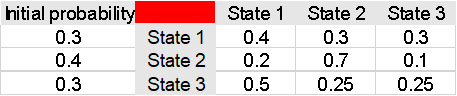
The above table illustrates the default 'State Transition Matrix' data format. For a three-state system, three initial probability values and a 3×3 state transition matrix must be provided.
If using 'State Data', the corresponding dataset should be selected, and the system will automatically identify different states. Researchers only need to input the initial probability values for each state.
Algorithm
1.Data Preparation
Define the system states and list all possible states. Collect data and record state changes over time to construct the transition probability matrix.
2.Construct the Transition Probability Matrix
Calculate the transition probabilities between states based on historical data. The transition probability matrix P is defined as: Given n states, Pij represents the probability of transitioning from state i to state j.
3.Initial State Matrix
Define the initial state vector π(0), which represents the probability distribution of states at the initial time:
4.Iterative Computation
Compute π(t) using P with the formula: π(t) = π(0)Pt, where where Pt represents P to the power of t. The iteration continues until the difference between π(t) and π(t - 1) falls below the convergence threshold. Record π(t) and π(t + 1), and π(t + 1) is for further verification of convergence.
References
【1】The SPSSAU project (2024). SPSSAU. (Version 24.0) [Online Application Software]. Retrieved from https://www.spssau.com.
【2】周俊,马世澎. SPSSAU科研数据分析方法与应用.第1版[M]. 电子工业出版社,2024.
【3】A. A. Markov (1971). "Extension of the limit theorems of probability theory to a sum of variables connected in a chain". reprinted in Appendix B of: R. Howard. Dynamic Probabilistic Systems, volume 1: Markov Chains. John Wiley and Sons.
【4】E. Nummelin. "General irreducible Markov chains and non-negative operators". Cambridge University Press, 1984, 2004. ISBN 0-521-60494-X.