Histogram
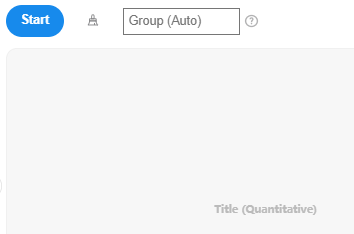
Histogram is a graphical tool used to represent data distribution by dividing data into multiple bins and calculating the frequency of data points within each bin. SPSSAU supports:
Batch analyze 'titles'.
Automatically set bins by default, with manual bins configuration also available.

Calculation Steps
The histogram algorithm consists of several steps, including data binning, boundary determination, bin frequency calculation, histogram drawing, and normal distribution curve fitting, as detailed below:
Data Binning
Data values in the dataset are divided into several bins. SPSSAU determines the bins automatically by default, but researchers can manually specify the bins.
Boundary Determination
The boundaries of the bins are determined based on the minimum and maximum values of the dataset. Suppose the minimum value of the dataset is xmin, and the maximum value is xmax, then the bin width can be calculated based on the desired number of bins (b):
Frequency Calculation
For each bin, the number of data points falling within it (frequency) is counted. If the boundary of the jth bin is [ej,ej+1), the frequency is:
Iis an indicator function, which equals 1 when the condition is true and 0 otherwise.
Histogram Drawing
In a histogram, the horizontal axis represents bins, while the vertical axis represents the corresponding frequencies. The height of each rectangle indicates the frequency for that bin. Additionally, SPSSAU provides a default normal distribution curve to help visualize the data distribution. The normal distribution curve is calculated using the Probability Density Function (PDF), with the formula as follows:
- f(x) is the probability density at point x.
- μ is the mean, representing the center of the distribution.
- σ is the standard deviation.
- e is the base of the natural logarithm (approximately 2.71828).
- π is the mathematical constant (approximately 3.14159).