Error Bar Plot
Error Bar Plot is a graphical tool used to represent data uncertainty or variability. SPSSAU supports:
Batch generate word cloud for 'titles'.
Draw Box Plot with up to 2 grouping variables (e.g., gender, education).
Three types of error representation: Mean 95% CI, Standard Deviation, and Standard Error.

The chart includes 'titles' and specific data. The 'Weight' represents the corresponding count of the sample, and the numerical meaning can be set through 'Data Label'.
Data Format

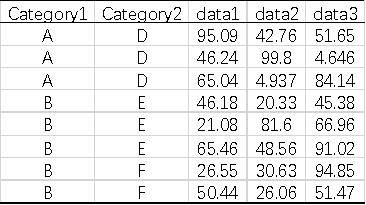
The data includes two Categories and the analysis data (Categories can be omitted during analysis).