Decision Making Trial and Evaluation Laboratory (DEMATEL)
DEMATEL (Decision Making Trial and Evaluation Laboratory) is a systematic analysis method that utilizes graph theory and matrix tools to interpret problems. It is located in SPSSAU -> Comprehensive Evaluation -> DEMATEL.
SPSSAU Operations
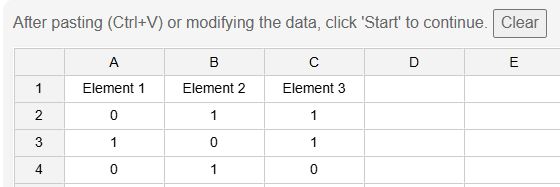
After pasting the direct influence matrix data, click 'Start'. SPSSAU includes the parameter 'Max Value Normalization'.
Max Value Normalization: This parameter is selected by default and is used to normalize the direct influence matrix by scaling its dimensions.
SPSSAU Data Format
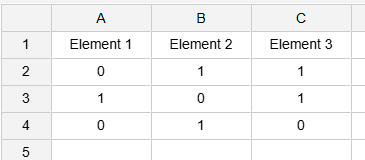
To perform a DEMATEL analysis, simply paste the data into the table (or manually edit it within the table). The data format for DEMATEL is as follows: the first row contains the titles, the second row onward contains the data, which must be in a square matrix (i.e., the number of rows and columns must be equal, excluding the title). The lower right triangular section of the matrix must contain only zeros.
Algorithm
1.Construct the Direct Influence Matrix
Experts assign scores to the direct influence between factors to construct the direct influence matrix A = [aij]n×n, where aij represents the degree of direct influence of factor i on factor j.
2.Normalize the Direct Influence Matrix
The normalized direct influence matrix D is calculated by dividing each element of the direct influence matrix by its maximum value.
3.Calculate the Total Influence Matrix
The total influence matrix T is calculated as follows:
I is the identity matrix, and k is the smallest integer that ensures .
4.Calculate Influence Degree
rj and cj are calculated as follows:
5.Calculate Centrality and Cause Degree
Mi and Ri are calculated as follows:
6.Calculate Factor Weights
The weight of each factor is calculated as:
7.Generate the Influence Relationship Diagram
The influence relationship diagram is plotted as follows: X-axis () represents the sum of influence degree and being influenced degree, indicating the importance of the factor. Y-axis () represents the difference between influence degree and being influenced degree, reflecting the influence relationship of the factor.
References
【1】The SPSSAU project (2024). SPSSAU. (Version 24.0) [Online Application Software]. Retrieved from https://www.spssau.com.
【2】周俊,马世澎. SPSSAU科研数据分析方法与应用.第1版[M]. 电子工业出版社,2024.
【3】Seyed-Hosseini S M , Safaei N , Asgharpour M J . Reprioritization of failures in a system failure mode and effects analysis by decision making trial and evaluation laboratory technique[J]. Reliability Engineering & System Safety, 2006, 91(8):872-881.