Best Worst Method (BWM)
Best Worst Method (BWM) is an effective multi-criteria decision-making approach primarily used to determine the weight of various factors. It is located in SPSSAU ->Comprehensive Evaluation -> Best Worst Weight (BWM).
SPSSAU Operations
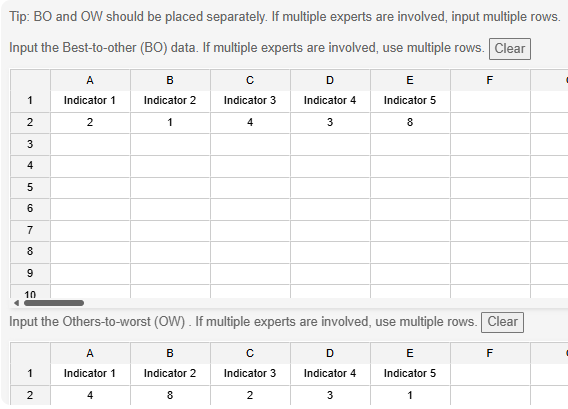
To conduct the analysis, input Best-to-other (BO) data and Others-to-worst (OW) data into their respective data frames and click 'Start'. Note: If multiple experts provide ratings, there will be multiple rows of BO or OW data.
SPSSAU Data Format
Details regarding Best-to-other (BO) data and Others-to-worst (OW) data are as follows.
Algorithm
1.Define Criteria Indicators
First, all indicators relevant to the decision-making problem must be identified. The number of indicators is typically limited. Experts rate these indicators and determine the best (optimal) indicator and worst (least optimal) indicator. Scores are assigned based on these two indicators. A predefined scale (e.g., a 1~9 scale, where 1 represents the least important and 9 represents the most important) is used for rating.
Best-to-other (BO) data represents the relative importance of the best indicator compared to each indicator. Others-to-worst (OW) data represents the relative importance of each indicator compared to the worst indicator. For instance, if there are five indicators, each expert will provide 5 BO values and 5 OW values, totaling 10 values. If multiple experts are involved, the process is repeated accordingly. In BO data, a higher value indicates that the indicator is less important. In OW data, a higher value indicates that the indicator is more important.
2.Construct the Comparison Matrix
A ratio matrix is constructed based on the best and worst combination indicators obtained in the previous step.
BO = (aB1 aB2 aB3 ... aBn) OW = (a1W a2W a3W ... anW)
- In the equation:
- n represents the number of experts.
- aBj represents the relative score of the best indicator compared to indicator j.
- ajW represents the relative score of indicator j compared to the worst indicator.
3.Calculate Weights
The criterion weights are determined using the following optimization model:
s.t.
Constraints:
- is the error term; the smaller the value, the better.
- wB represents the weight of the best criterion.
- wW represents the weight of the worst criterion.
- wj represents the weight of criterion j.
- aBj represents the comparison value of the best criterion relative to criterion j.
- ajW represents the comparison value of criterion j relative to the worst criterion.
4.Consistency Test
To ensure consistency in judgment, the following formula is used for verification:
CI is determined based on the number of indicators, as shown below:
| Consistency Index(CI) | |||||||||
|---|---|---|---|---|---|---|---|---|---|
| Order | 1 | 2 | 3 | 4 | 5 | 6 | 7 | 8 | 9 |
| CI | 0.00 | 0.44 | 1.00 | 1.63 | 2.30 | 3.00 | 3.73 | 4.47 | 5.23 |
CR is the consistency ratio. Generally, the smaller the value, the higher the consistency. If CR > 0.5, reassessment of judgments may be necessary.
References
【1】The SPSSAU project (2024). SPSSAU. (Version 24.0) [Online Application Software]. Retrieved from https://www.spssau.com.
【2】Rezaei J .Best-worst multi-criteria decision-making method: Some properties and a linear model[J].Omega, 2016, 64(oct.):126-130.DOI:10.1016/j.omega.2015.12.001.