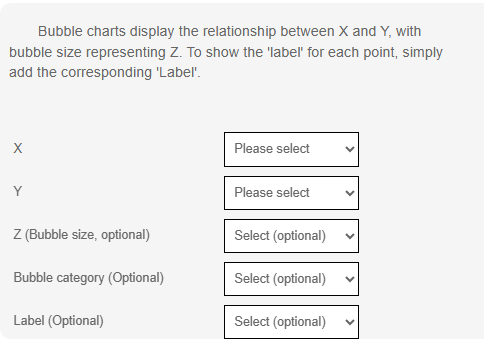
Bubble Chart
Bubble Chart is essentially a scatter plot, but each point varies in size (bubble) and can display labels. The Bubble Chart consists of balloon-like circular points, where each circle represents a data point. It has the following features:
X-Axis and Y-Axis: Represent the two main attributes or variables of the data. The bubble's position on the X and Y axes reflects the values of these two variables.
Z Bubble Size: Represents the third attribute of the data; the larger the bubble, the greater the value of the third variable for that data point.
Bubble Category: The color or type of the bubble indicates grouping information, with different colors representing different categories or groups.
Label Item: Labels on the bubbles provide additional information, such as the name of the data point or other important details.
Data Format
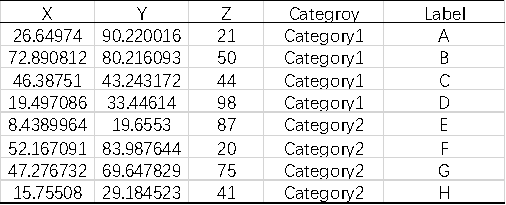
The data includes X and Y as mandatory fields, Z represents bubble size, Category denotes the category of the point, and Label is used to identify specific information about the scatter points.